Academic
Data Visualisation Gallery (ITP2 Final)
2026 · 4 weeks
Grade · 88/100
About this project
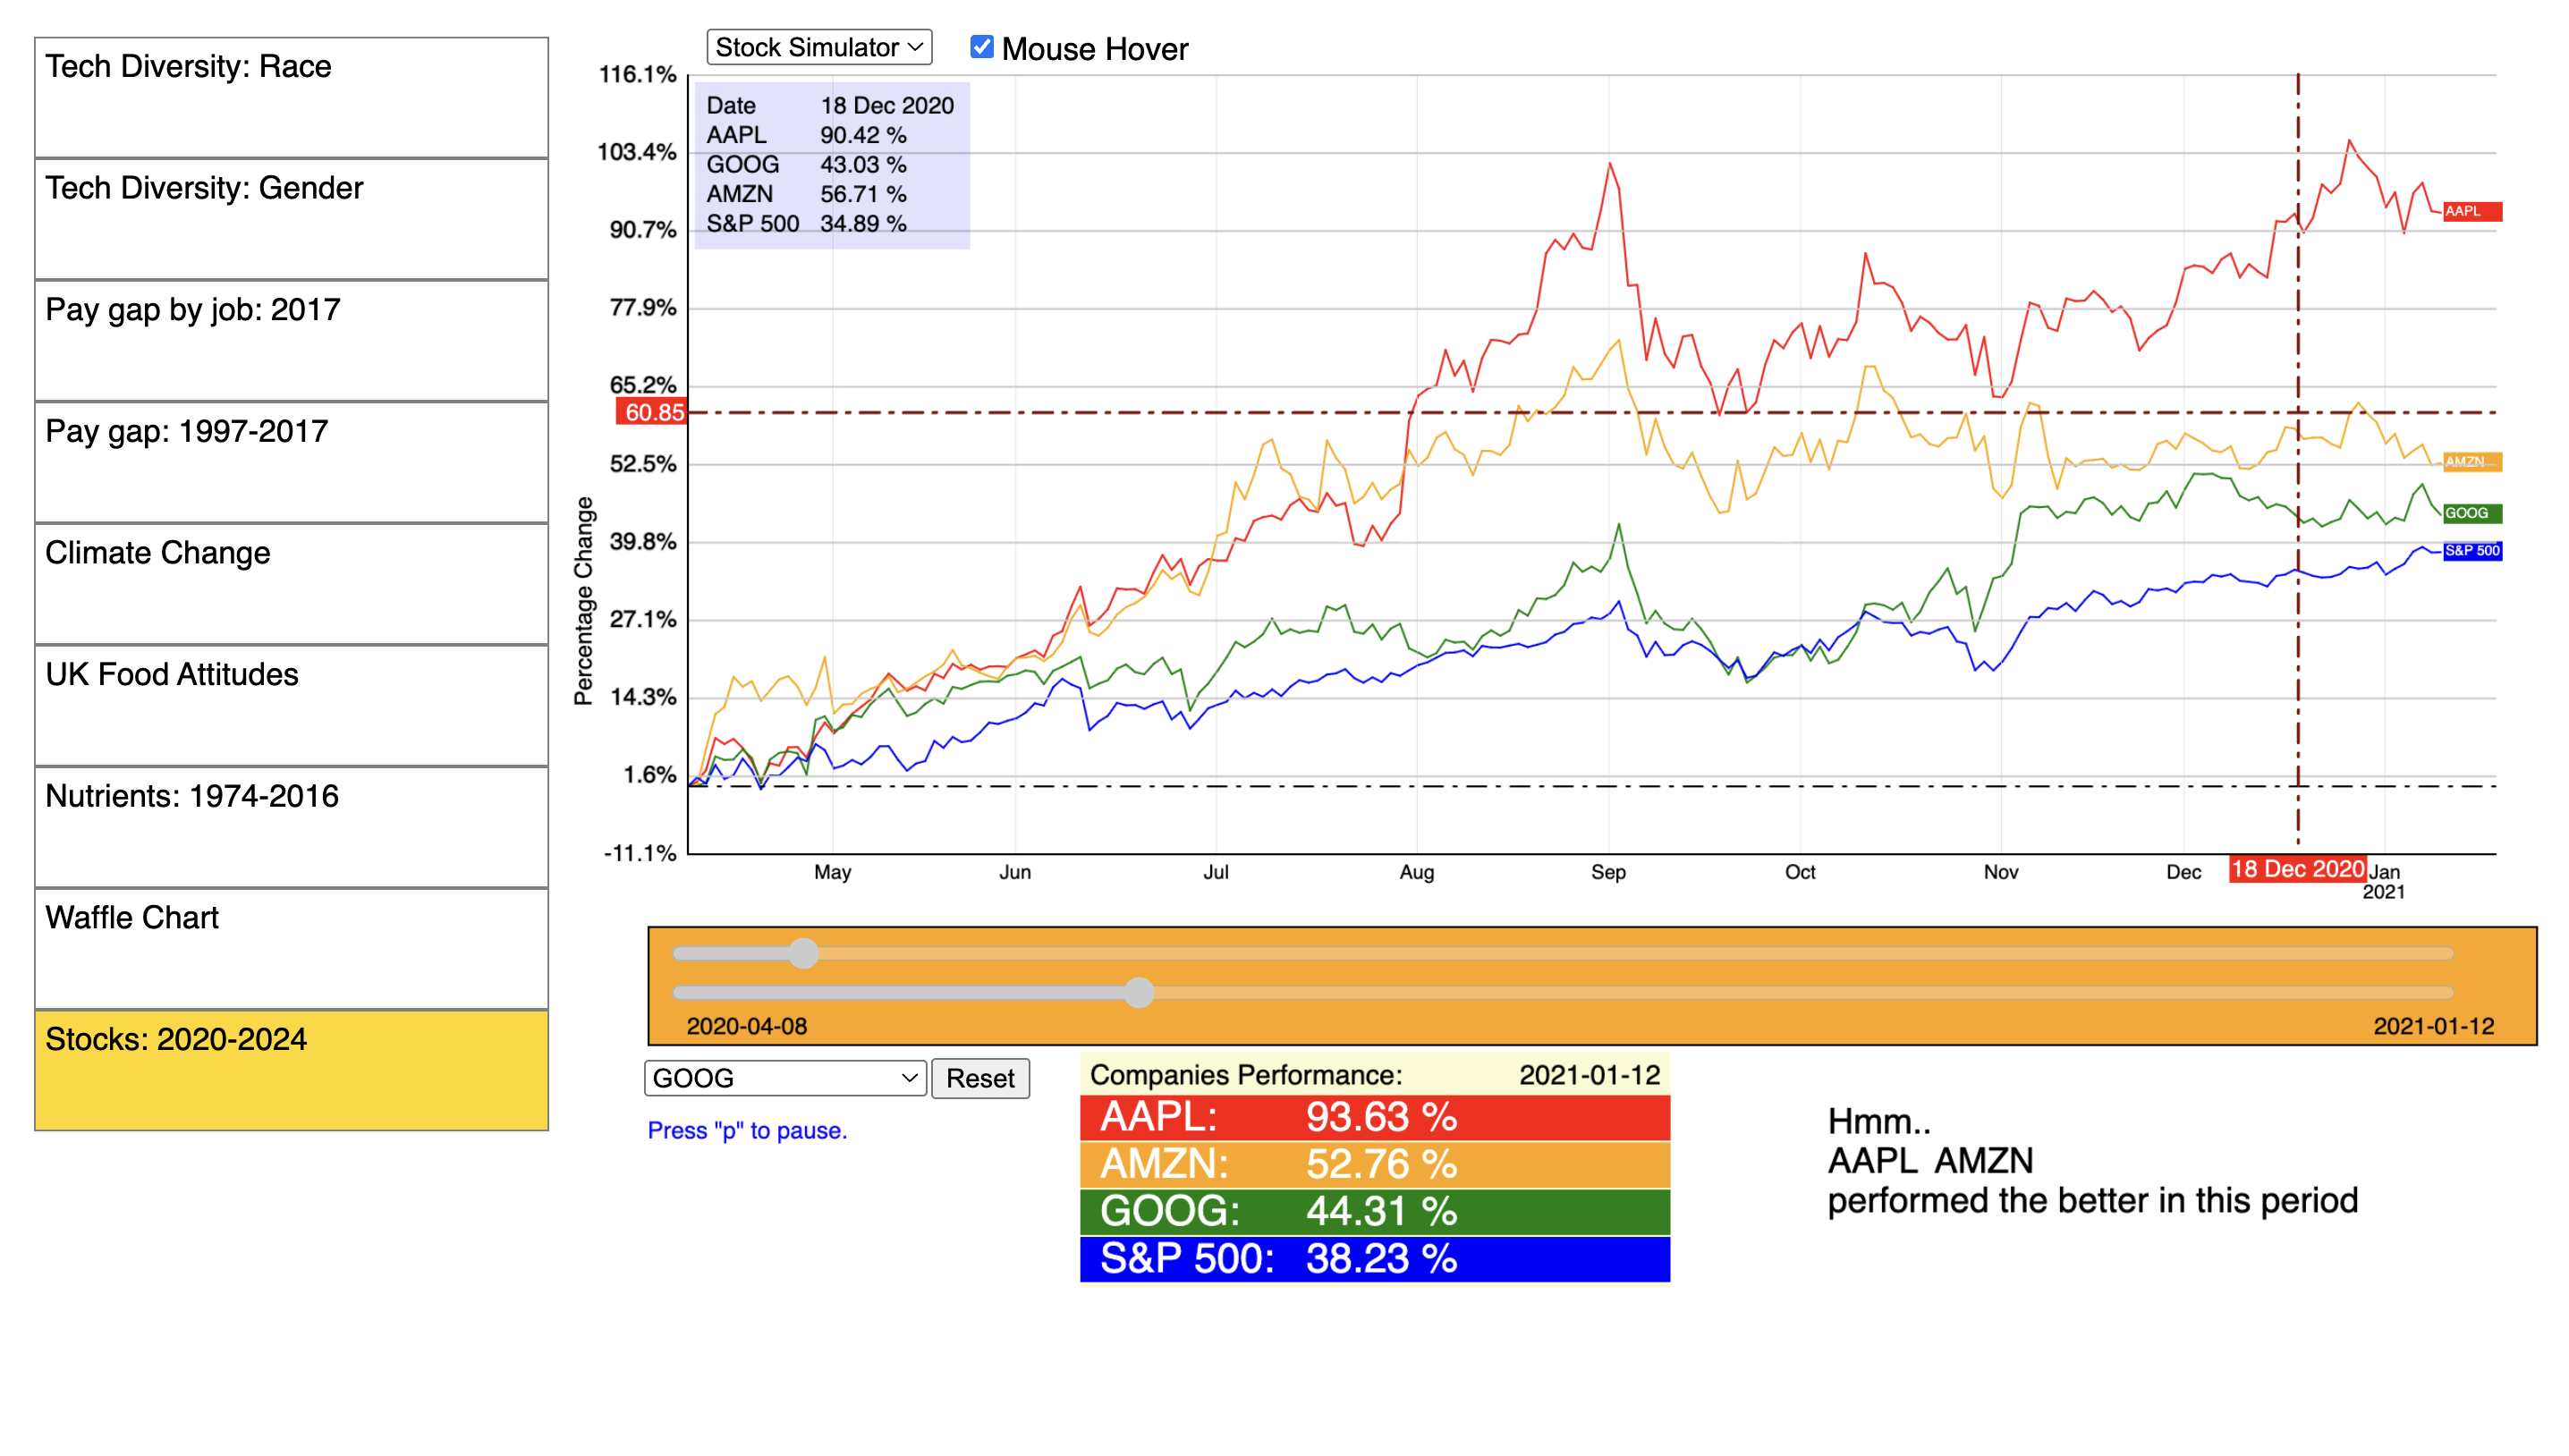
An ITP2 Final Coursework (University of London) data visualisation gallery built in p5.js. A single menu loads real-world datasets as interactive sketches sharing a common lifecycle (setup/draw/preload/destroy) so the gallery can swap canvases cleanly. Included visualisations: 📊 Tech workforce diversity (race & gender) 💰 Gender pay gap by occupation (2017) and over time (1997–2017) 🌡️ Global surface temperature / climate change 🍎 UK food attitudes 🥗 Nutrients over time (1974–2016) with hover emphasis, year range, nutrient filters, rotated axis labels 🧇 Waffle chart with checkboxes, dynamic totals, and hover details 📈 Stock data viewer & simulator with mouse-wheel zoom, drag-to-pan, intervals, moving averages, multi-stock selection, animations, and pause Going beyond the spec: - Gallery abstraction that registers views so each sketch sets up and tears down cleanly - Stock viewer with a full interaction model (zoom, pan, hover, animate, pause) - Nutrients view with multi-dimensional filtering and rotated axis labels
Tech stack
- p5.js
- JavaScript
- HTML5
- CSS3