Academic
Weather Visualiser CLI (OOP Midterm)
2024 · 4 weeks
Grade · 84/100
About this project
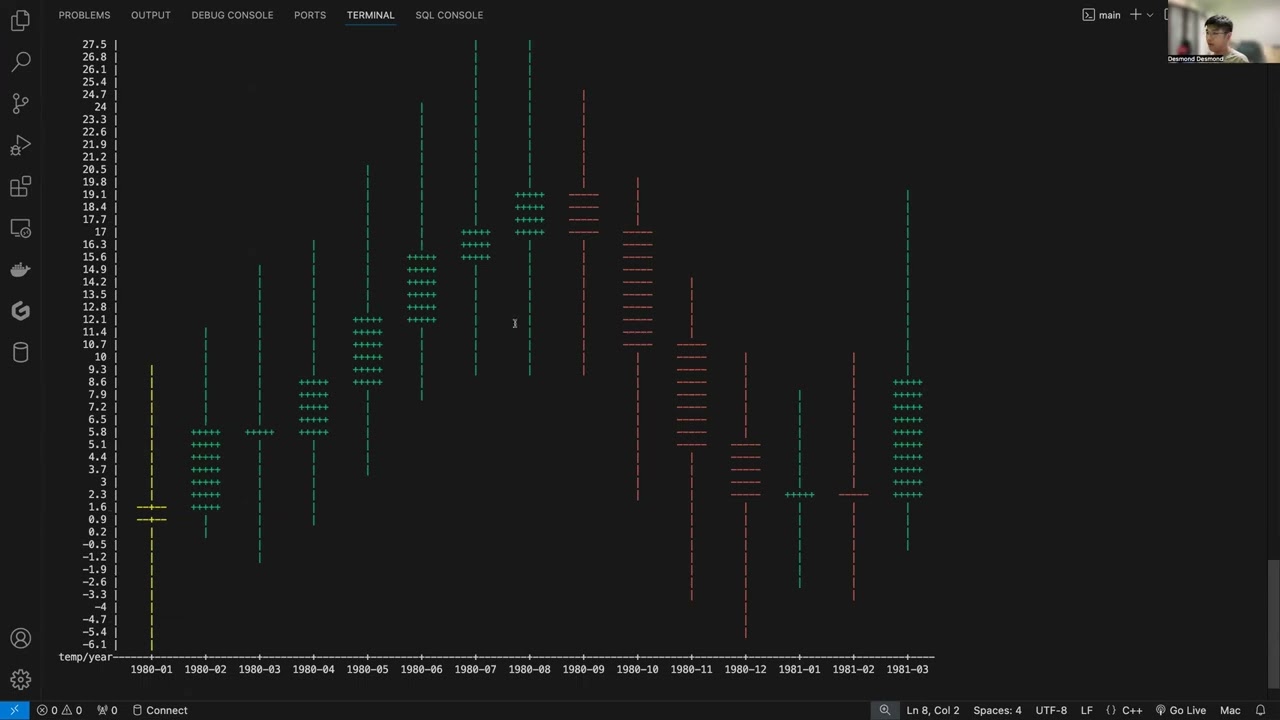
A C++ OOP Midterm project (University of London) that analyses 40 years (1980–2019) of temperature data across 28 European countries and renders it as ASCII candlestick charts — a technique borrowed from financial markets. Features: 🌡️ CSV parsing for daily temperatures across 28 European countries 📊 Monthly and yearly OHLC (Open/High/Low/Close) candlesticks rendered as ASCII 🔍 Filter by country (trend over time) or by date (compare across countries) 📈 Bull/bear/doji trend markers for warming, cooling, and flat periods 🔮 Temperature prediction using Annual Mean Growth Rate (AMGR) 💻 Interactive menu-driven CLI Going beyond the spec: - Candlestick metaphor applied to temperature data, complete with trend classification - AMGR-based prediction algorithm projecting future OHLC values from historical data - Clean OOP separation across `WeatherEntry`, `Candlestick`, `ProcessData`, and `WeatherMain`
Tech stack
- C++
- Object-Oriented Programming
- CLI